Wall Street is indexing K-beauty. Two-thirds of it sits on one shelf.
Korean trade press is covering K-beauty's arrival on the New York exchange — and, in the same breath, delisting pressure on marginal firms. Our shelf data explains why both are true at once: the category is real, but 67% of its brands have distribution on exactly one channel.
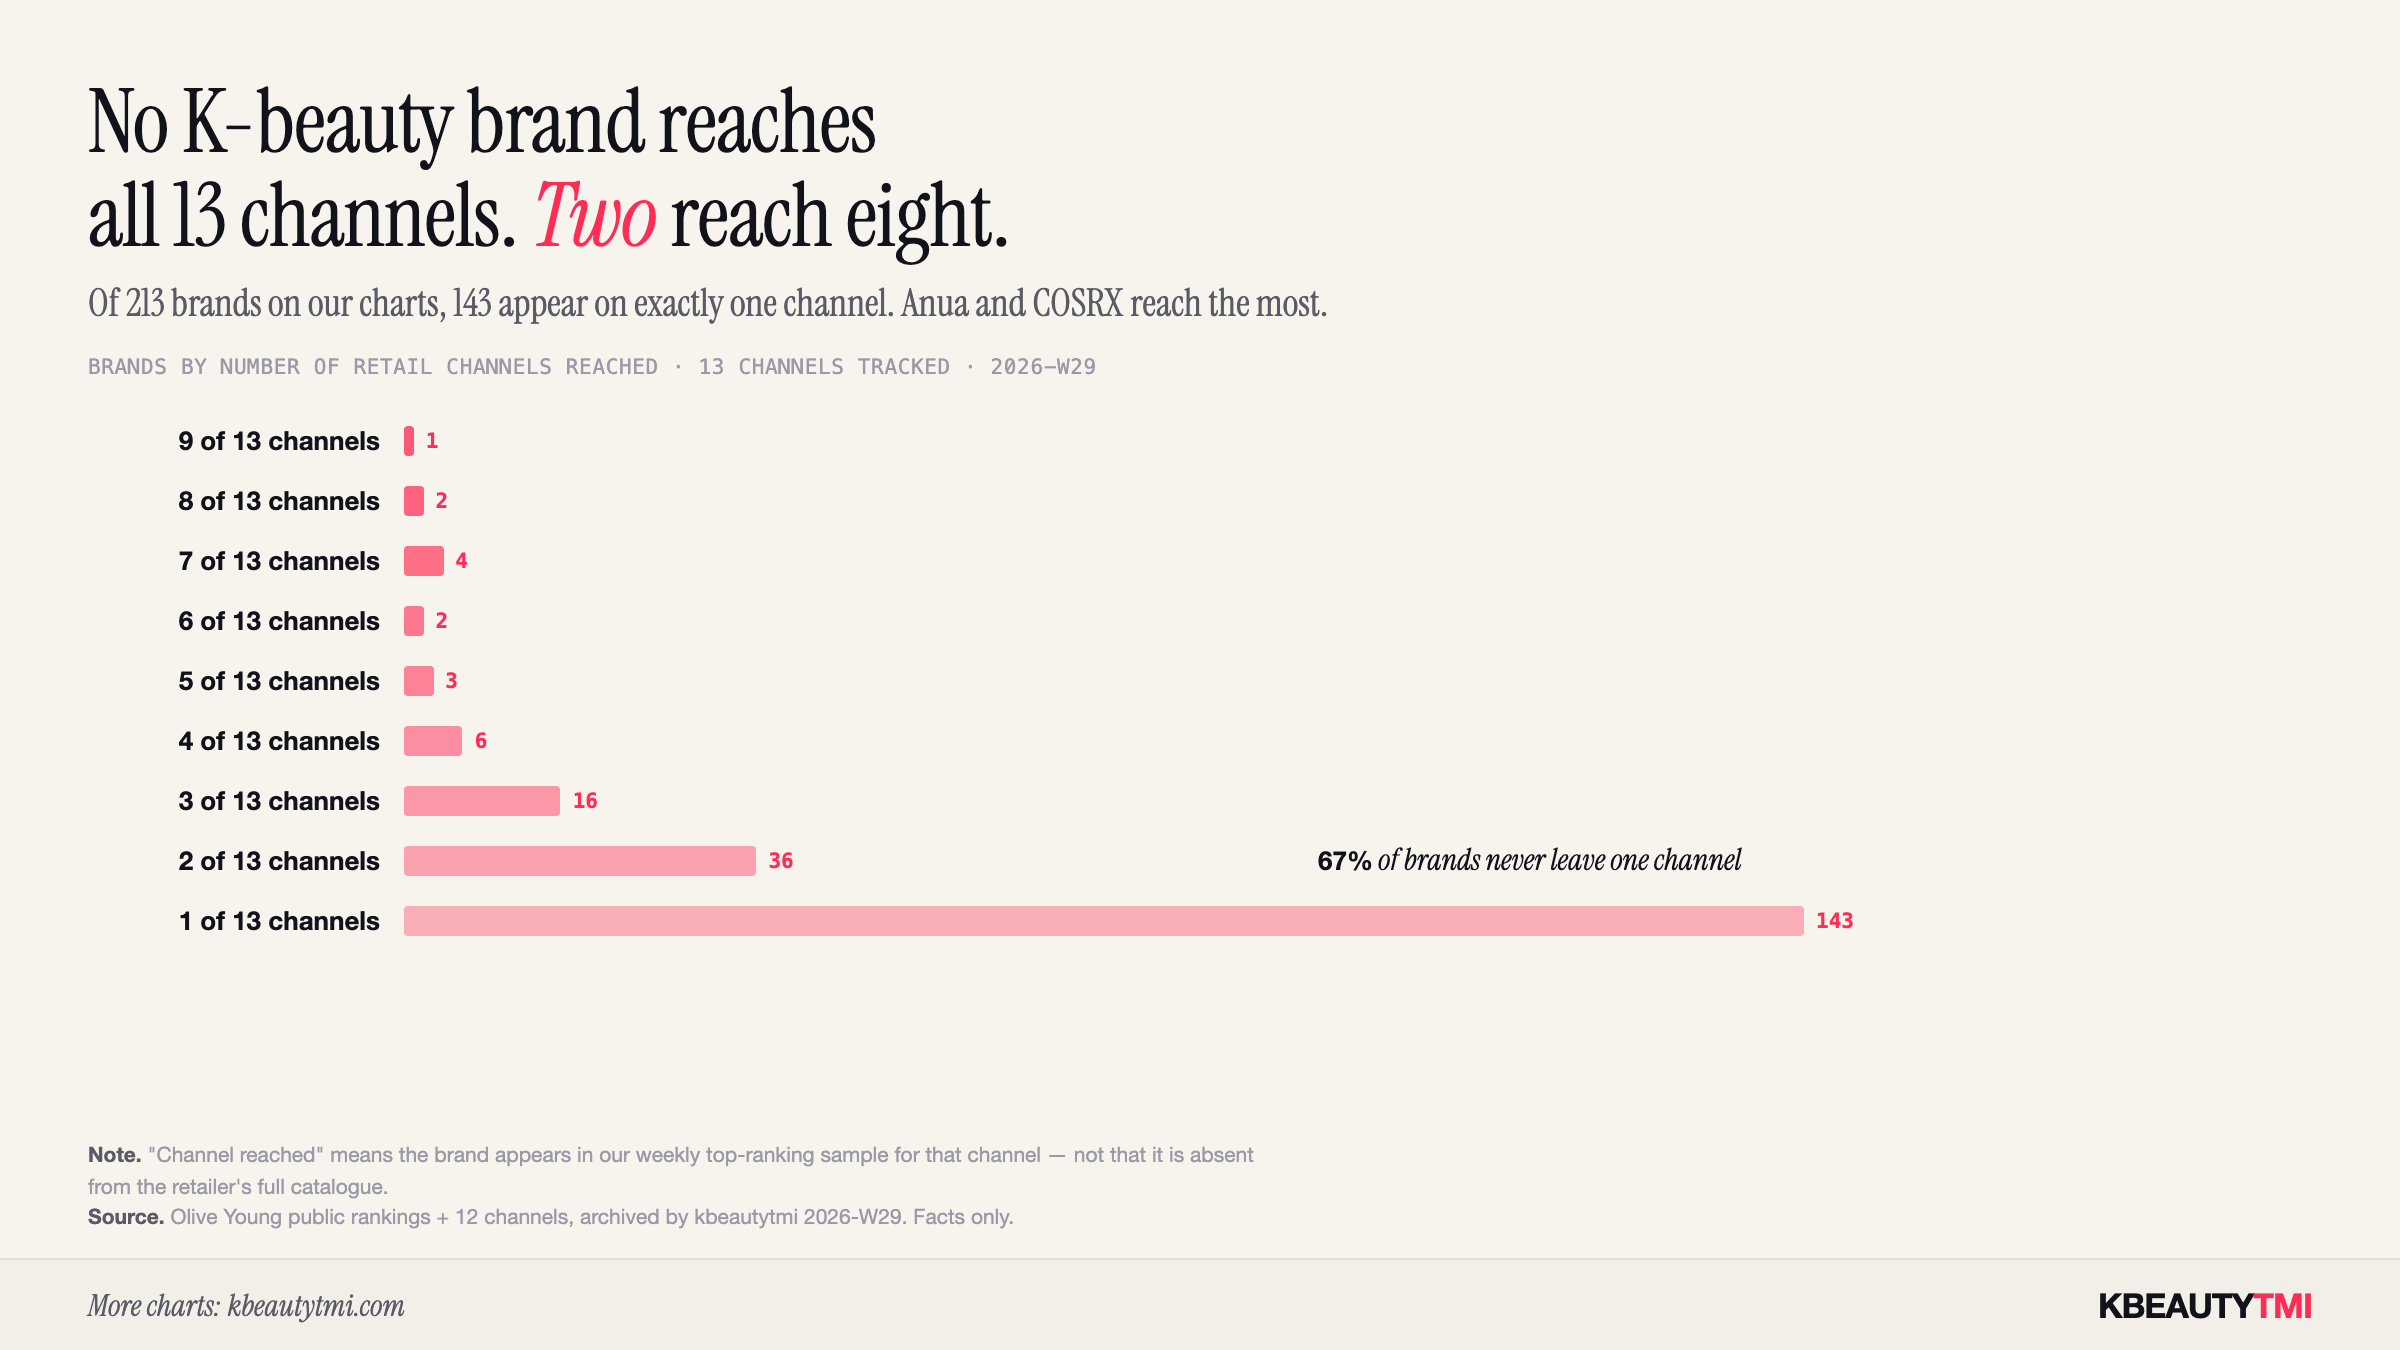
Korean industry coverage this month carried two framings side by side: K-beauty stepping onto the New York exchange as an investable theme, and — in the same reporting — pressure building on marginal firms to exit. Those read as contradictory. On our charts they are the same fact seen from two heights.
An index buys a category. A shelf buys a brand.
An index treats K-beauty as one asset: exports, manufacturing capacity, aggregate demand. All of that is genuinely strong, and a record export half-year backs it.
Distribution does not aggregate the same way. Of the 221 brands on our charts, 148 sit on exactly one channel. Only 16 brands reach five or more. The widest reach anyone has is 11 of 15.
So the category is broad and the individual brands are narrow — simultaneously. An investor holding the theme owns both, but only one of them shows up in an export statistic.
Where the sorting actually happens
The layer under pressure is not manufacturing or export volume. It is the layer where a brand competes for one customer's repeat purchase — and that layer is exactly what a weekly ranking snapshot measures.
A brand on one channel has one demand source. If that channel's buyer changes their mind, its distribution goes to zero in a week. A brand on nine has resilience that no export figure captures. That difference is invisible in an aggregate and obvious on a ladder.
The honest limit of our own data
We cannot see the firms under the most pressure. Companies small enough to be pushed out were rarely large enough to appear in a top-ranking sample in the first place. Our charts show the sorting among brands that already cleared the visibility bar — not the tail below it.
What we can say is narrower and more checkable: among visible brands, distribution is far more concentrated than the category's headline numbers imply.
What we'll watch next
If the sorting thesis is right, it should be visible as movement: brands adding channels, and brands disappearing from ones they held. From W30 our archive can show that week by week — which is the one thing an index cannot do until it shows up in earnings.
"Wall Street is indexing K-beauty. Two-thirds of it sits on one shelf." — kbeautytmi, 2026-W29. https://kbeautytmi.com/stories/wall-street-index-vs-one-channel-reality-2026-w29
↗ Chart image — free to use with credit Free to cite — rankings can't be collected retroactively, so this archive exists nowhere else.